Benchmark: ChitraMaya vs lada — same GPU, same video, same models
A few of you asked how ChitraMaya's speed compares to lada. Fair question — so I ran a head-to-head on the
weakest machine I own: an RTX 3060
6 GB in a Frankenstein build (GPU-Z screenshot attached). Same source video, same detection model, same encoder settings on both sides.
The setup
- Source: 1080p / 29.97 fps, 194,773 frames (1 h 48 m of video)
- Detection model: lada_mosaic_detection_model_v4_accurate (both tools)
- Restoration: lada's BasicVSR++ generic v1.2 (both tools)
- Encoder: HEVC NVENC, preset P7, QP 18 (both tools)
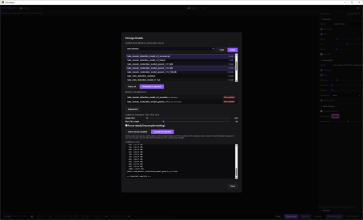
- lada run via lada-cli with the flags shown in the attached screenshot
Results (total wall clock, start to finished file)
Code:
Run                                Wall time    Avg speed   vs realtime
lada CLI (PyTorch, clip 180)       2:27:33      22.0 fps       0.73x
ChitraMaya (PyTorch, MCL 180)      2:10:54      24.8 fps       0.83x
ChitraMaya (TensorRT, MCL 90)      1:17:37      41.8 fps       1.40x
ChitraMaya with its compiled TensorRT engines finished in roughly half lada's time — 1.9× faster — on a 6 GB card. The middle row is the apples-to-apples control: same PyTorch backend, same clip length 180 as lada, and ChitraMaya is still ~13% faster purely from pipeline engineering (fully threaded NVDEC decode, batched detection, everything staying on the GPU end to end). The TensorRT row on top of that is why the app compiles engines for your specific card.
Did quality pay for it? No — and I can show it, because ChitraMaya writes a per-run report. Both ChitraMaya runs detected mosaic on the identical 121,153 frames and restored ~121,890; the TensorRT run's visible-miss count was actually slightly
lower (1,379 vs 1,389 — about 1% of mosaic frames, mostly single-frame scene edges). lada doesn't emit comparable stats, so the comparison there is wall clock only.
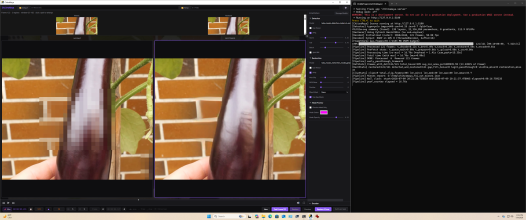
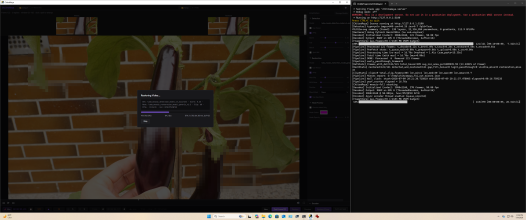
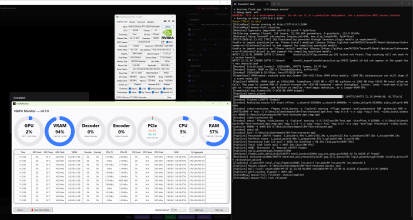
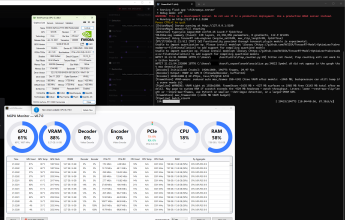
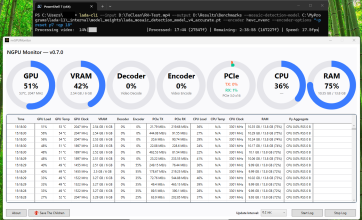
Why it's faster: the monitor screenshots tell the story. During lada's run the GPU sits around 50% load with 2.5 GB of VRAM used — the card is half idle. ChitraMaya keeps the same card 60%+ busy with VRAM deliberately packed to ~88% (a VRAM-aware frame store sized to the card). Same silicon, more of it working at once.
Honest caveats: the headline row runs ChitraMaya at its recommended Max Clip 90 vs lada's 180 (the PyTorch@180 row is there so you can compare like-for-like); default detection confidence between the two tools may differ slightly; and this is one video on one card — your content and hardware will vary. lada's on-screen "fps" is an instantaneous reading, so I compared total wall time on both sides.
Credit where it's due: ChitraMaya uses
lada's excellent models — the speedup is pipeline engineering around them, and none of this exists without that upstream work.
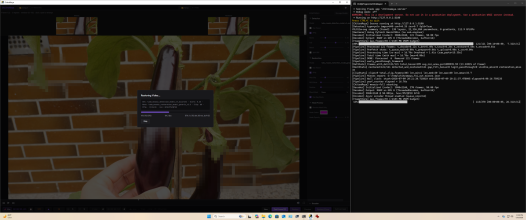
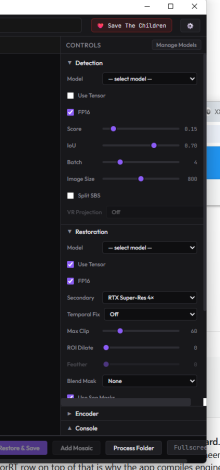
Screenshots attached: both consoles at completion, mid-run monitor gauges for each, and GPU-Z of the test card.
Reminder for new downloaders: the installer is THREE files (.7z.001, .7z.002, .exe) — download all three into the same folder, then run the .exe. The .exe alone is just the unpacker.
▶ ChitraMaya Releases: github.com/seatv/ChitraMaya/releases
▶ Monitoring Tool Releases: https://github.com/mountlord/nvGPUMonitor[/url



 github.com

)
)